 Enclosure, box or cabinet: Whatever you want to call them, where you install your speaker or subwoofer is critically important to their resulting performance. In this article, we focus on the simplest and most forgiving of enclosures to design and construct – the acoustic suspension or sealed enclosure.
The Laws of Physics
There are a few characteristics to keep in mind about every speaker. The first is that as frequency decreases, cone excursion increases. In fact, to produce the same acoustic output, a speaker must move four times as far for every halving of frequency. As an example, if your subwoofer were moving 1 mm at 80 Hz, it would have to move 4 mm to produce the same output at 40 Hz. To produce the same output at 20 Hz, it would have to move 16 mm.
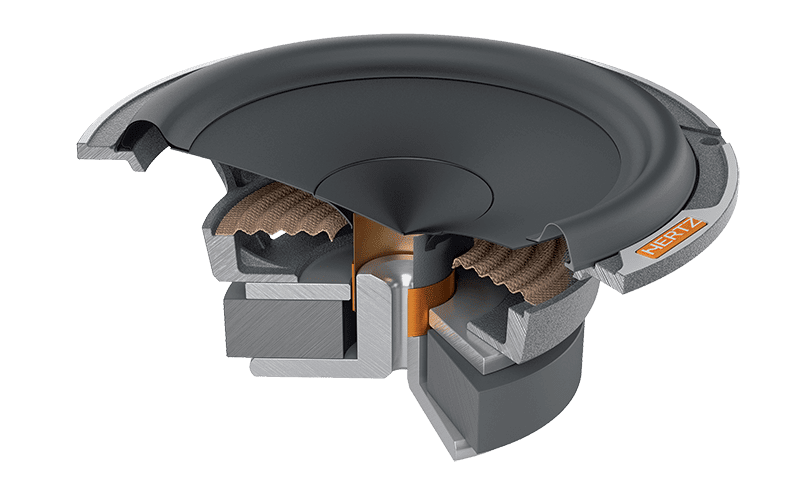
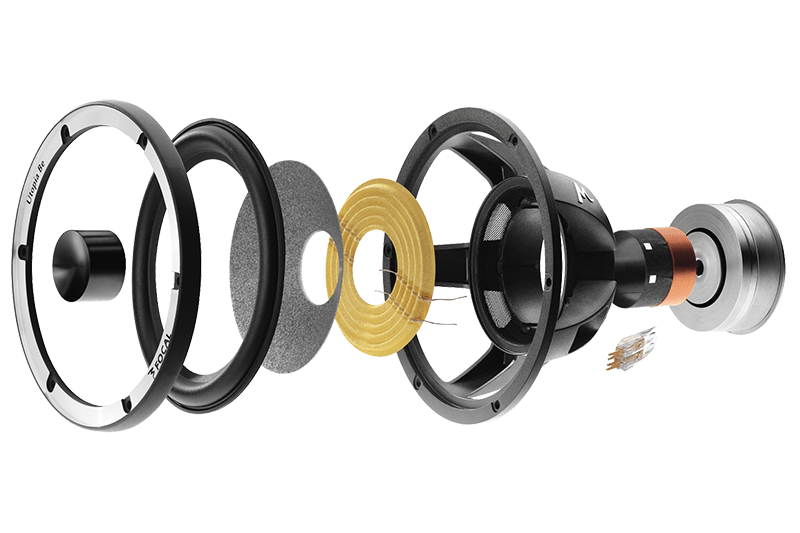
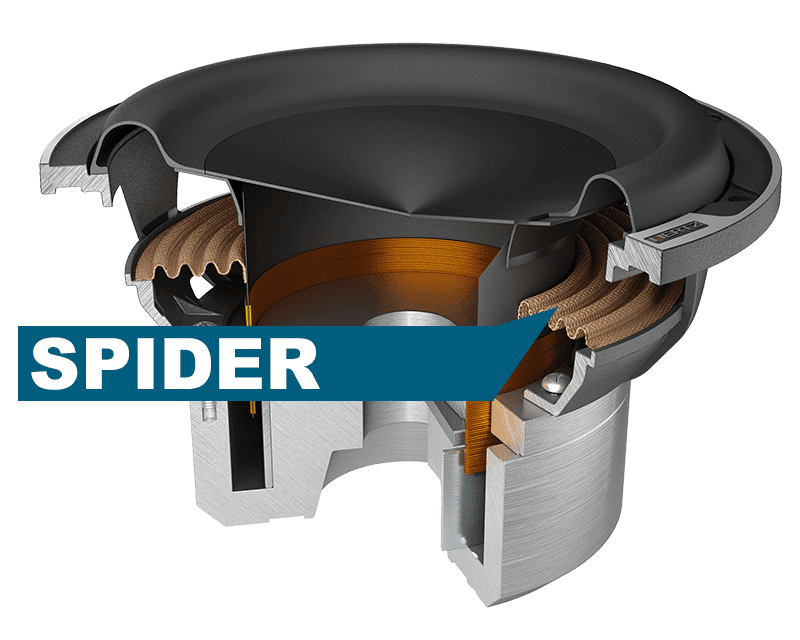 A speaker includes an element called a spider. The spider stores energy when the voice coil of a speaker moves the cone forward or rearward from its resting position. When the cone reaches the end of its travel and comes to a stop, the stored potential energy in the spider wants to be released. This stored energy pulls the cone in the opposite direction. Each transfer of energy includes some losses, and eventually, the cone comes to rest.
Think of the cone motion like a swing at the park. You exert a force on the swing to get it started, and it continues to swing back and forth with a decreasing amplitude until it comes to a stop. Thankfully, a speaker stops moving a lot faster than the swing at the park.
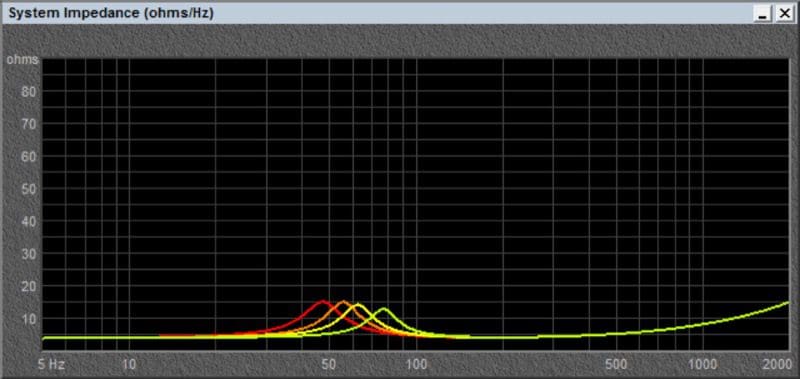
In a speaker, this transfer of energy from the cone to the spider and back is most efficient at a specific frequency. We call this the resonant frequency of the speaker. At the resonant frequency, there is a dramatic increase in impedance because the spider stores a great deal of energy. This energy storage causes the cone to want to continue to move. The movement of the voice coil moving through the magnetic field generates a voltage. This voltage generates a flow of current in the opposite direction to the current flowing from the amp. We represent this opposition to current flow as an increase in impedance.
We also have to consider that every speaker is limited in how far the cone can move. Once we exceed the excursion limitations of the speaker, bad things happen. The voice coil former can hit the back plate. The suspension components may be compromised and start to fail. As a by-product of the cone, dust cap, surround, spider and motor geometry, harmonic distortion also increases as excursion increases.
Our goal in designing any audio system should be to keep distortion as low as possible. Most of the distortion at low frequencies is resonance. These resonances decrease as we move above the resonant frequency of the speaker. The spider and the changing motor force, as the coil moves past the edge of the gap, are the biggest contributors to distortion.
Why Do We Need an Enclosure?
Let’s consider a few additional characteristics. The low-frequency roll-off of a speaker is a high-pass filter. The spider in the speaker is like a capacitor—a spring stores energy and so does a capacitor. The air inside the box is also a spring, and it is in parallel with the spider. The air spring and the spider work together at the same time to do the same thing. The combination of the air spring and the spider increases the high-pass filter frequency. Yes: Contrary to our efforts to produce as much low-frequency information as possible, an enclosure limits low-frequency reproduction.
If that is the case, why do we want to limit cone motion? Consider what we’ve said about how much excursion is required to reproduce low frequencies and about distortion. Limiting low-frequency output from our speaker is not an ideal goal, but limiting some of the really low frequencies to get the right amount of bass at higher frequencies is worthwhile.
There is a benefit to increasing the resonant frequency of the speaker and enclosure system. Let us say we have a subwoofer with a Q of 0.5 and it is our goal to have a total system Q of 0.707. We choose an enclosure air volume that increases the Q, which then increases the system output at the new resonant frequency. Yes, we sacrifice output at lower frequencies, but we gain output around the new system resonant frequency.
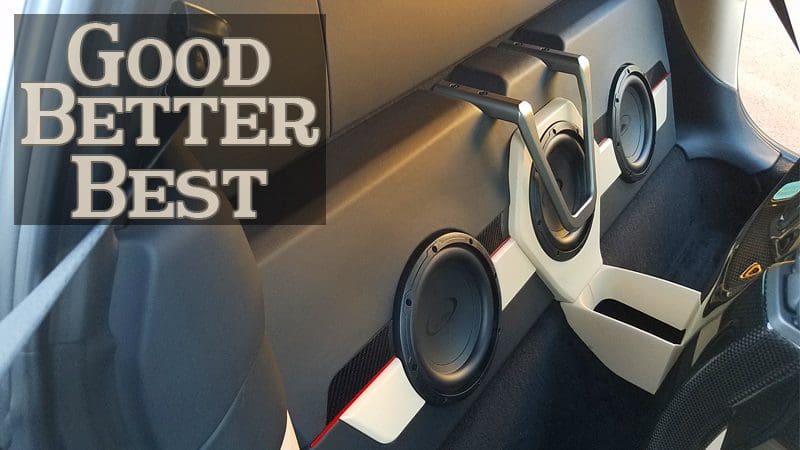
I Want More Bass!
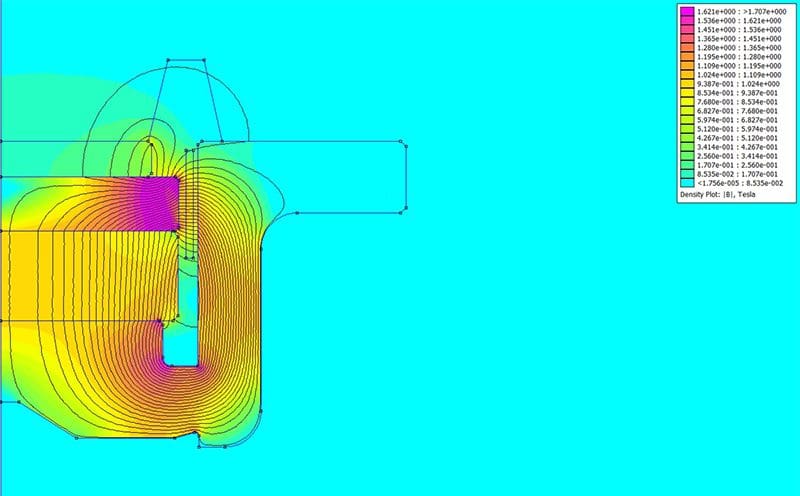
Modern speaker designs continue to reduce distortion through computer simulation and modeling of material behavior. Qualified and properly equipped speaker designers can simulate spider, cone and surround behavior to analyze individual resonance and distortion behaviors. They also can model the interaction between the voice coil and the motor structure to predict changes in magnetic field strength and inductance that can further affect how a speaker will sound at moderate to high excursion levels.
These advancements have resulted in speakers that produce less distortion at higher excursion levels. This improvement in performance allows enclosure designers to build speaker systems that will play lower and louder.
Some basic principles govern low-frequency sound reproduction. Cone area is critical. An old article published by the Audio Engineering Society called “The Problem with Low-Frequency Reproduction,” by Saul J. White, included a graph that compared cone excursion vs. frequency vs. system output for a 12- and 15-inch loudspeaker. In the chart, it shows that a 15-inch driver cone only has to move half as much as a 12-inch driver to produce the same output.
To produce sound, we need to displace air. Displacement is calculated by the product of speaker cone area times the distance the cone can travel. In other words, bore times stroke. For the same displacement, more bore requires less stroke.
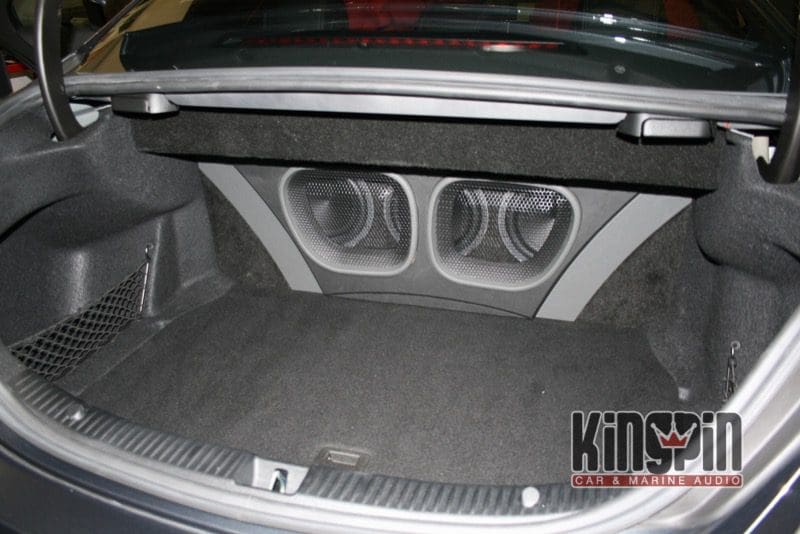
What is the punch line? If you want it louder, buy more speakers or subwoofers.
Driver Behavior in an Enclosure
The increase in the system Q caused by the addition of air stiffness in the enclosure can cause distortion if the Q is increased excessively. This increase in Q works against our desire for a low-distortion system. Making the enclosure too small increases the Q too much, and we wind up with a system that produces a great deal of output in a narrow frequency range. These undersized enclosures are often referred to as a “one-note-wonders.”
What causes this behavior? The one-note quality is a result of the increased energy storage and transference in the resonant system. The bass just keeps going and going – like our swing at the park.
Power Handling
In an acoustic suspension enclosure, cone excursion increases as frequency decreases. This increase in excursion continues down to the frequency at which the force of the spider and the box exceeds the force of the motor. At that point, the excursion level is limited, and we will not see the increase in excursion . The result: We protect the speaker from physical damage due to cone excursion beyond the design characteristics of the speaker.
Predicting the limits of cone excursion relative to frequency and power is relatively simple for a sealed enclosure. The volume of the enclosure is inversely proportional to the amount of power the speaker can handle when perceived from the standpoint of excursion. A small enclosure limits cone excursion a great deal at very low frequencies, but the system does not produce a lot of deep bass. A large enclosure allows the speaker to move further and produce more low-frequency output, but we cannot drive the speaker with as much power for fear of damaging it.
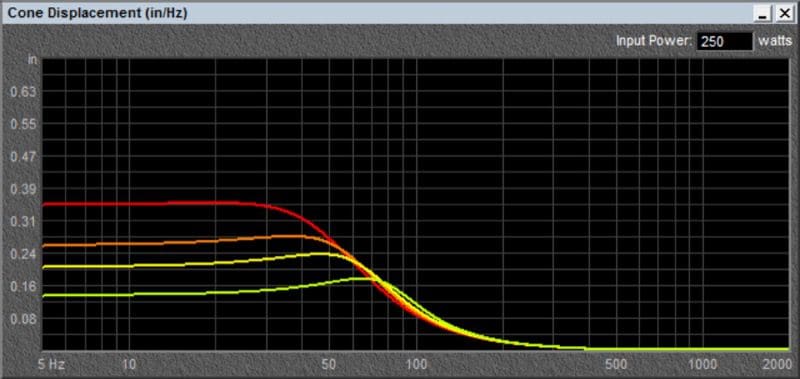 As we increase the volume of the subwoofer enclosure, the air inside has less “spring effect” on the subwoofer’s motion. This graph shows the increase in driver excursion as air volume increases in four different enclosures.
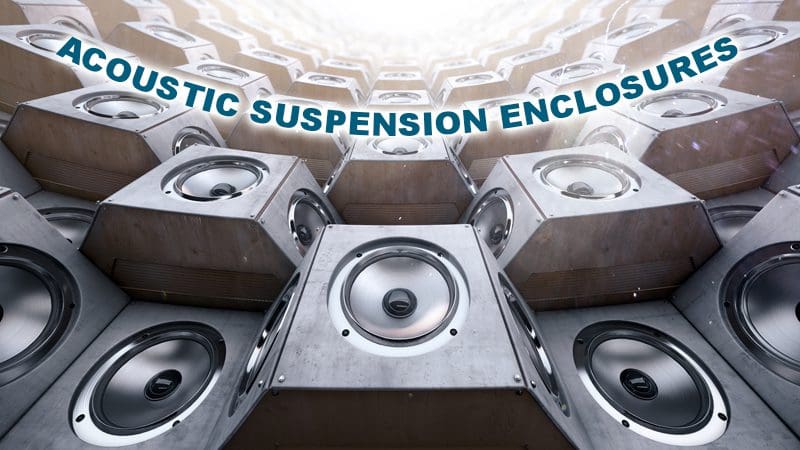
Acoustic Suspension Overview
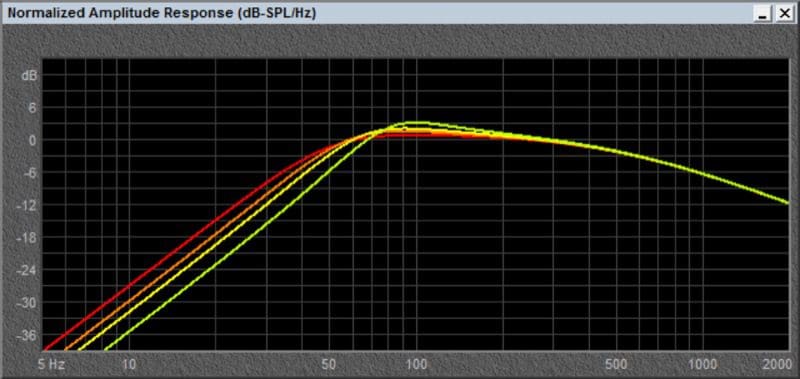
An acoustic suspension speaker enclosure reduces bass output at a rate of -12 dB per octave below the resonant frequency. When you combine this roll-off with the cabin gain associated with most vehicles, you can get excellent and linear low-frequency extension well into the infrasonic region. Acoustic suspension enclosures are easy to calculate and to construct. They are very forgiving of minor errors in volume calculation.
Finally, it is worth remembering that acoustic suspension enclosures are not the lowest-distortion enclosure designs available.
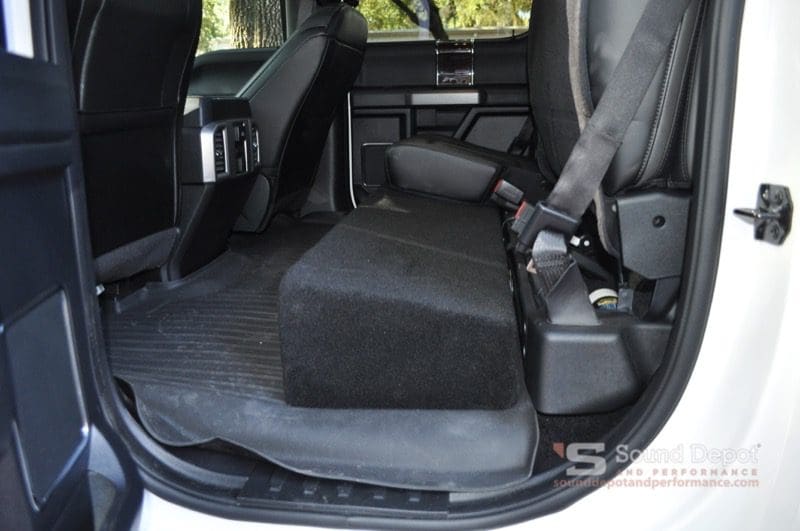
When it comes time to design a subwoofer enclosure for your car or truck, visit your local mobile electronics retailer and discuss your requirements. They can help you choose a subwoofer and enclosure design that will give you a solid foundation on which to build your audio system.
This article is written and produced by the team at www.BestCarAudio.com. Reproduction or use of any kind is prohibited without the express written permission of 1sixty8 media.